BrainCapture
Master’s thesis built in collaboration with BrainCapture — a DTU-spinoff medical-technology startup whose mission is to bring affordable, portable EEG scans and interpretations to the regions where they’re most needed.
The problem
Epilepsy affects roughly 50 million people worldwide, and around 80% of them live in low- and middle-income countries. Of those, an estimated 75% — about 30 million people — never get treated. The cost barrier is not the medication; that’s both cheap and accessible. The barrier is diagnosis. A standard diagnostic flow looks like this:
- An EEG technician operates an EEG machine to record a patient.
- A neurologist reviews the recording and makes the diagnostic call.
- If epilepsy is confirmed, seizure medication is prescribed and most patients (~70%) live seizure-free thereafter.
Step 1 needs an expensive machine and a trained operator. Step 2 needs a neurologist. In rural and low-income contexts, all three are scarce. The treatment itself works — getting to the point of being treated is what fails.
BrainCapture’s solution
BrainCapture replaces the bulky EEG machine + on-site technician with a Bluetooth EEG cap and a guided mobile application that walks an operator through a standardized recording. The recording is uploaded to cloud storage; from there a neurologist anywhere in the world can pull it up in a browser, review it, annotate it, and reach a diagnosis remotely. The same browser-based workflow also makes second opinions and collaboration between neurologists trivial — they can share findings and discuss the same recording without being in the same building (or country).
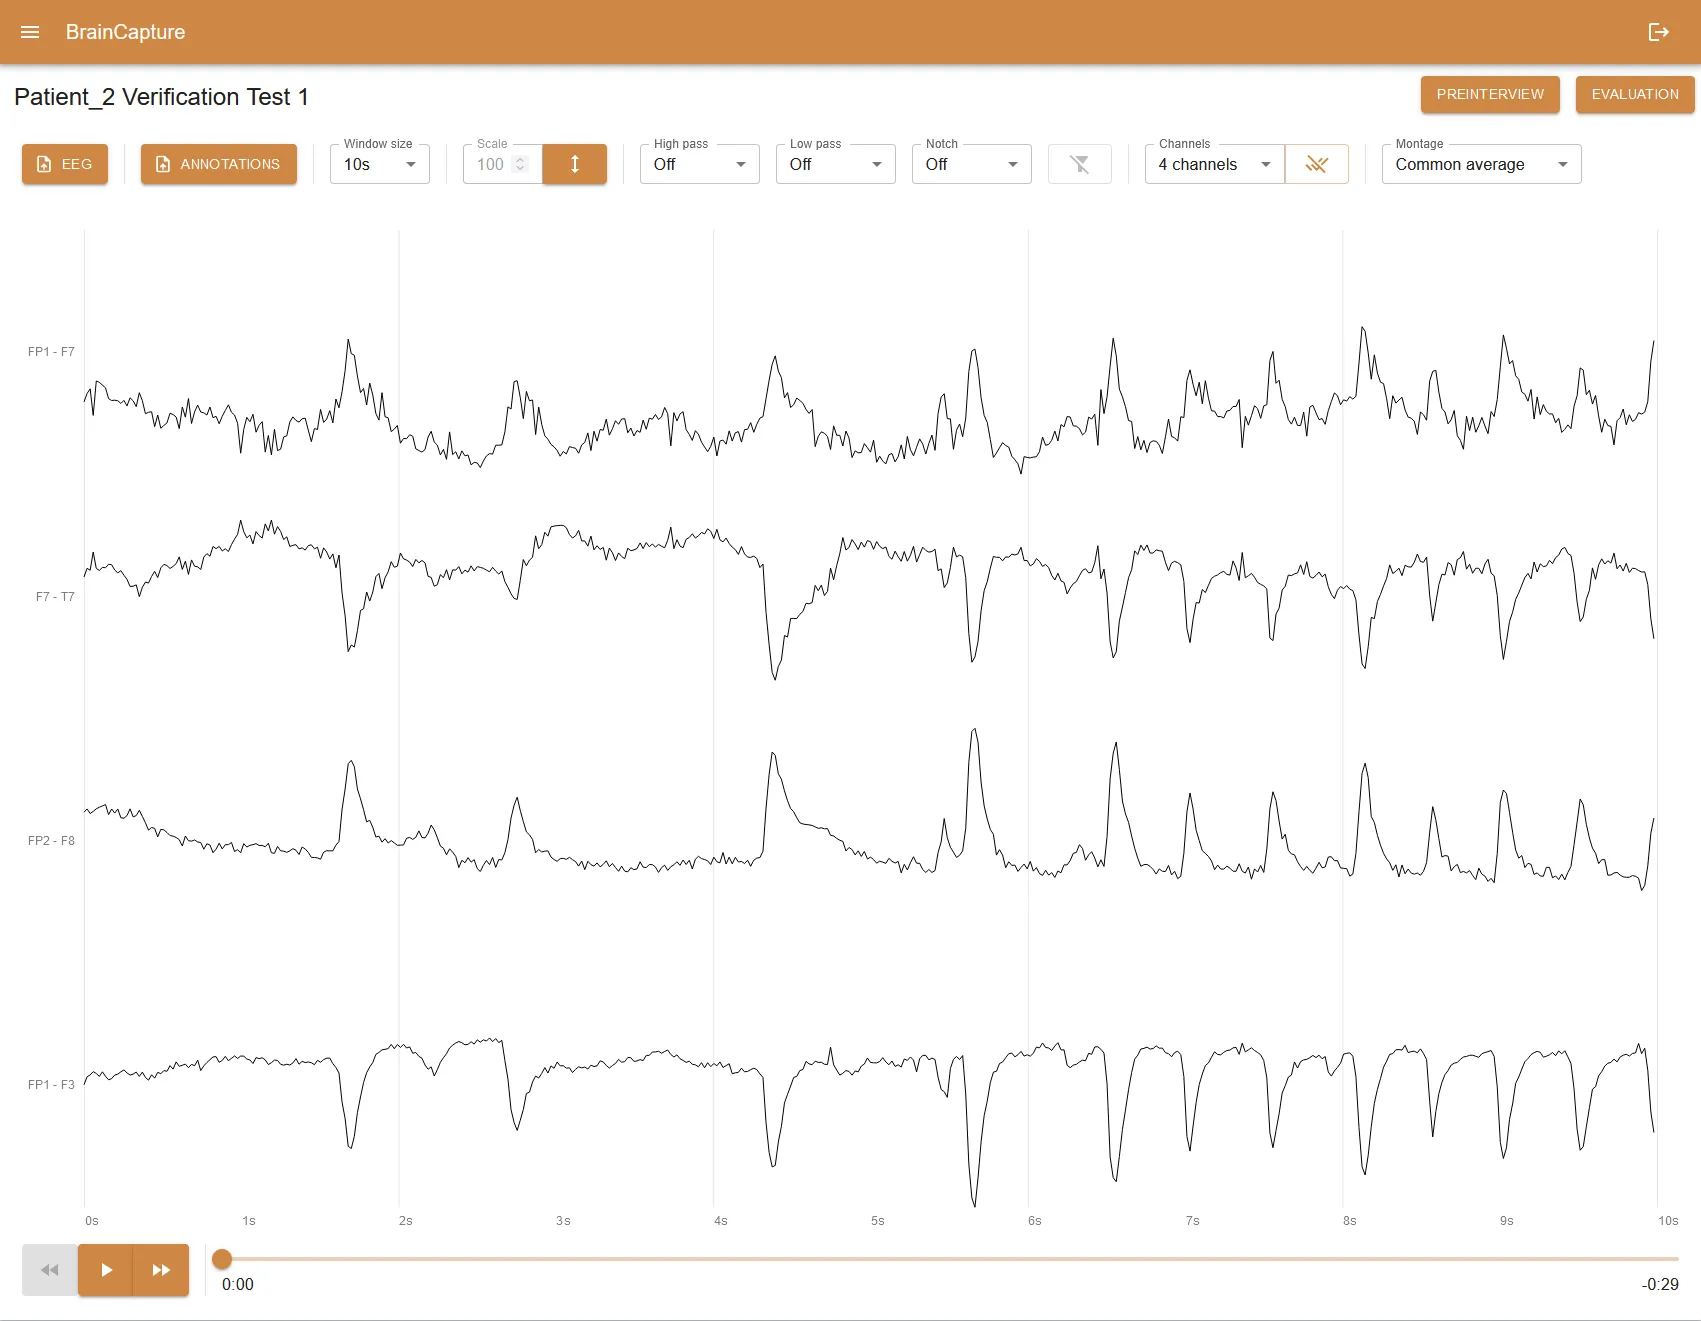
That last piece — the browser-based viewer — is what the thesis was about.
What I built
A web application for neurologists to read and analyze EEG recordings uploaded by the mobile capture flow. The thesis split the problem into two:
- How do you efficiently render an EEG recording in the browser? Recordings are dozens of channels of high-frequency time-series data, often hours long. Naive approaches choke fast, both on initial load and during interaction.
- What tools does a neurologist actually need to make a diagnosis from that rendering? Playback, scrubbing, montage switching, zoom, annotation — the difference between “you can see the data” and “you can work with it.”
Solving (1) was a performance problem dressed up as a UX problem. Solving (2) was about understanding the diagnostic workflow well enough to surface the right primitives without burying the neurologist in chrome.
A secondary thread of the work touched the cloud storage layer — the viewer can only be as good as the data feeding it, so part of the project was making sure recordings, metadata, and patient context arrived in a format the viewer could lean on.
Stack
- Web app — React + TypeScript, with a custom canvas-based renderer for the EEG traces (charting libraries didn’t keep up with the data density and pan/zoom interactions).
- Cloud storage — pulls recordings and metadata from BrainCapture’s existing pipeline.
- State — Redux Toolkit for the playback / annotation state, query layer for fetching recording chunks on demand.
Outcome
Shipped as the neurologist-facing side of BrainCapture’s diagnostic loop, paired with their Bluetooth cap and capture mobile app. The thesis is catalogued at DTU Findit. More on BrainCapture’s mission and product at braincapture.ai.