LiRA project
Bachelor’s thesis built in collaboration with the LiRA project at DTU. Live Road Assessment uses sensors built into ordinary passenger cars to model road condition with machine learning — replacing the expensive, specialised survey vehicles that road authorities have traditionally relied on. More cars means more data and more frequent updates, but it also means more sensor noise, more dropouts, and more opportunities for an entire stretch of road to end up with too little usable signal to draw any conclusion from.
The problem
Once you put data collection in the hands of consumer hardware and human drivers, errors are not edge cases — they are the default state of the dataset. Sensors fail, GPS jumps, rides are too short, segments overlap, calibration drifts. The raw signal isn’t human-readable either: rows of timestamped accelerometer / gyroscope / GPS samples do not jump out of a CSV and tell you anything.
Before any of this data can feed a machine-learning model, it has to be validated. Validation has two shapes:
- Manual inspection — domain experts asking questions of the data, looking at specific stretches of road, sanity-checking what the sensors saw against what they know of the route.
- Automatic validation — codified rules and algorithms that flag bad rides, missing segments, or insufficient coverage at scale.
The thesis built the tool to support both.
What I built
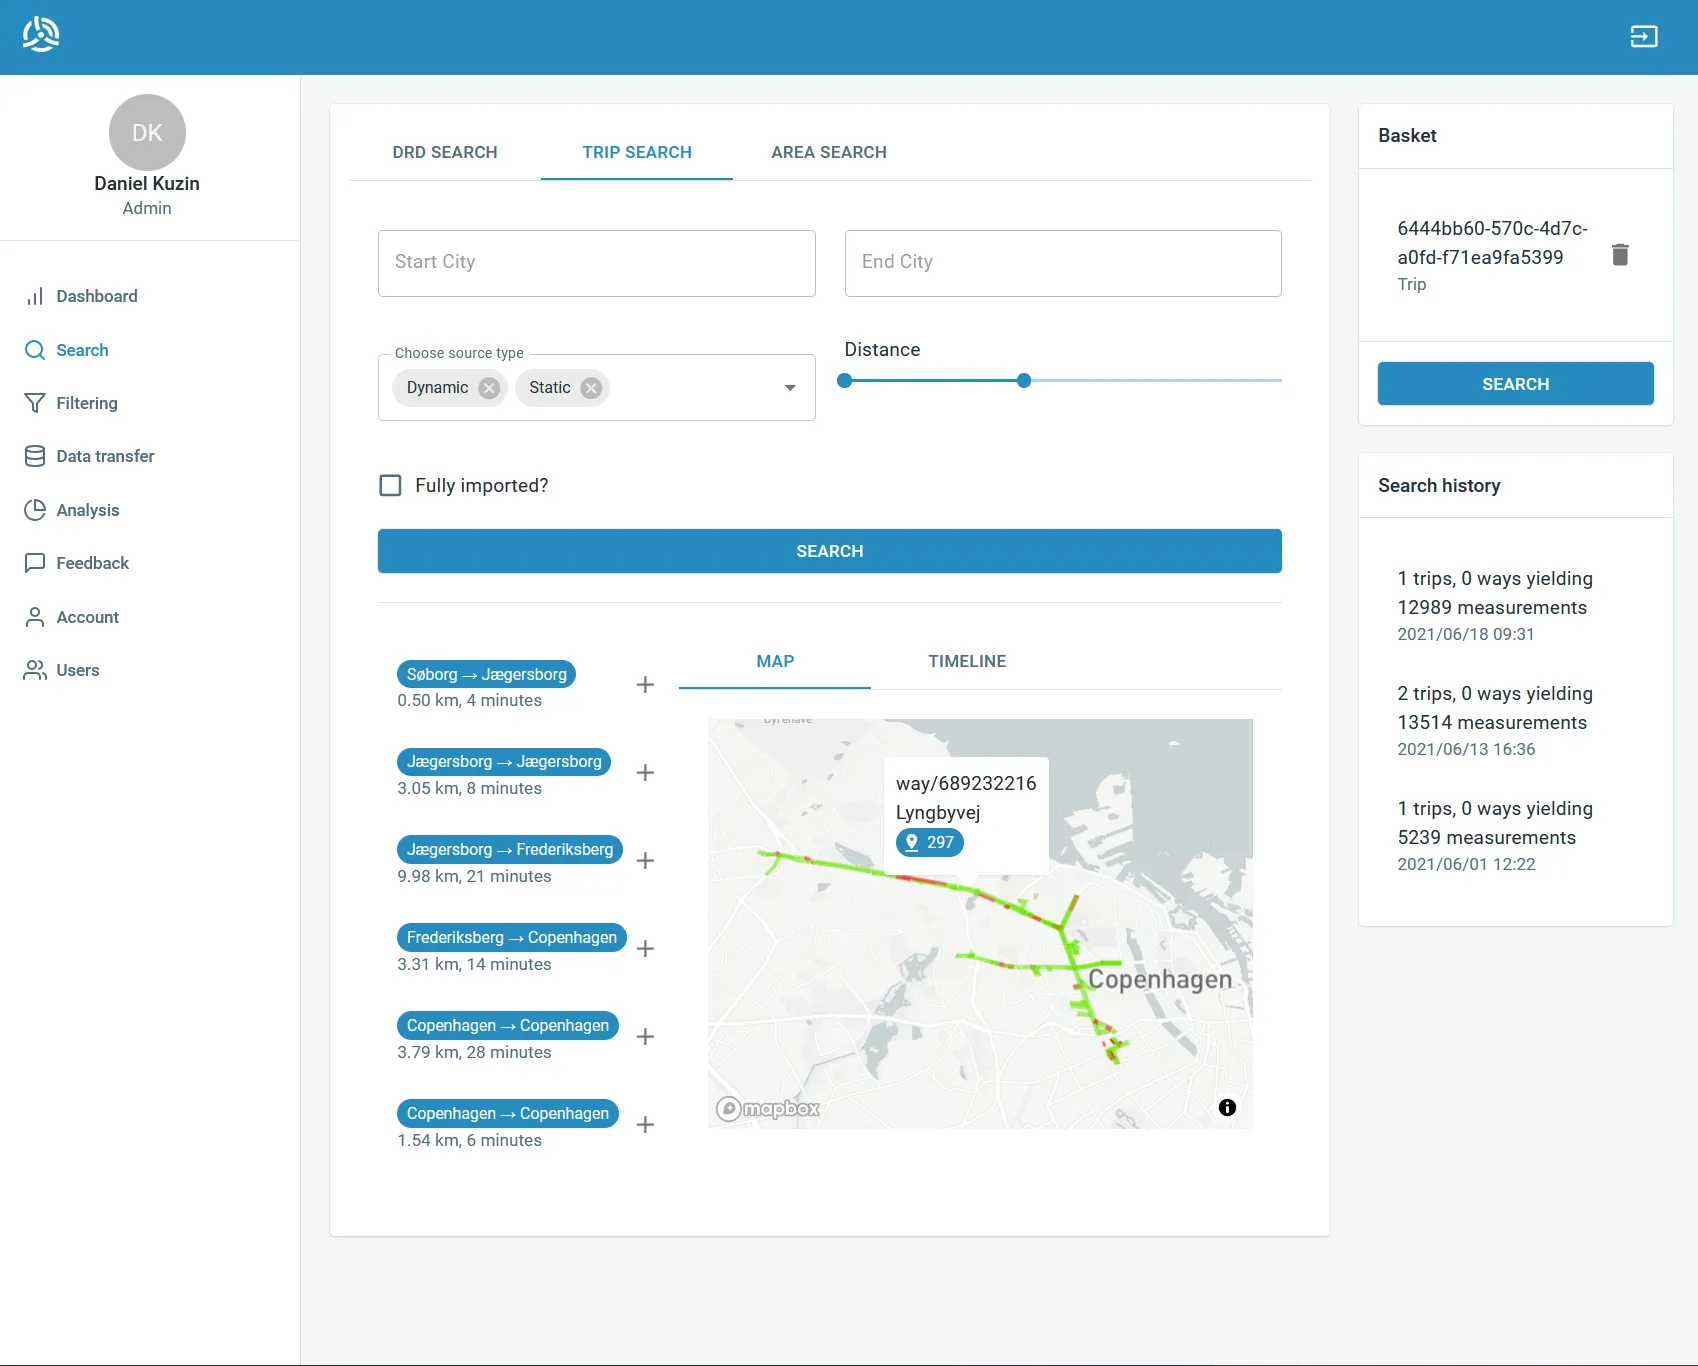
A web platform for querying, filtering, and visualizing rides — with the architecture and primitives needed to extend later into automated, rule-based validation.
- Query and filter rides by route, time window, sensor coverage, and other criteria, so a domain expert can isolate the segments worth inspecting without writing SQL.
- Visualize what got recorded — geographic context on a map, sensor traces over time, gaps and outliers marked clearly — so anomalies become noticeable instead of buried.
- Validate manually, marking rides as good / bad / suspicious with notes that flow back into the dataset.
- Define automatic checks — the foundations for triggers and analysis algorithms that can flag deficient data without a human in the loop, planned as the natural extension once the manual inspection workflow had revealed which checks were worth automating.
The whole thing was designed to be usable by non-programmers — a domain expert needed to be able to slice the dataset and reach a verdict without leaving the browser.
Stack
- React for the UI. The visual side of the tool is the entire product — interactive maps, scrubbable time-series, filter panels — so a component model with a fast iteration loop made the day-to-day pleasant.
- MUI for the design system. It gave the tool a coherent, professional look out of the box and freed time for the bits that were genuinely the project’s own (data plumbing, validation flows, visualisation choices) rather than re-implementing buttons and tables.
- A REST API on top of the LiRA dataset for the backend boundary, with ride and sensor models tuned for the filter / visualize / annotate flow.
Outcome
The tool shipped as the manual-inspection front of LiRA’s data quality pipeline and was the basis for follow-on work to automate the validation passes the domain experts were doing by hand.
The thesis is catalogued at DTU Findit, and broader LiRA project output is listed under LiRA publications.